

Remodel, Move, or Build New? The Real 2026 Math
If you own a home in the Sacramento region and it no longer fits your life — the kitchen is too small, there’s one bathroom for four people, the primary suite doesn’t exist — you have three ways out: remodel the house you have, sell it and buy one that works, or build new.
We’re a remodeling company, so you already know where our bread is buttered. That’s exactly why this post leans entirely on third-party data — NAHB construction cost surveys, Harvard’s Joint Center for Housing Studies, the Zonda/JLC Cost vs. Value Report, and current MLS data — rather than our opinion. The honest answer is that each path wins in certain situations, and we’ll tell you when moving or building genuinely makes more sense. But the numbers in 2026 are lopsided enough that every homeowner deserves to see them side by side before calling a realtor or a builder.
The short answer
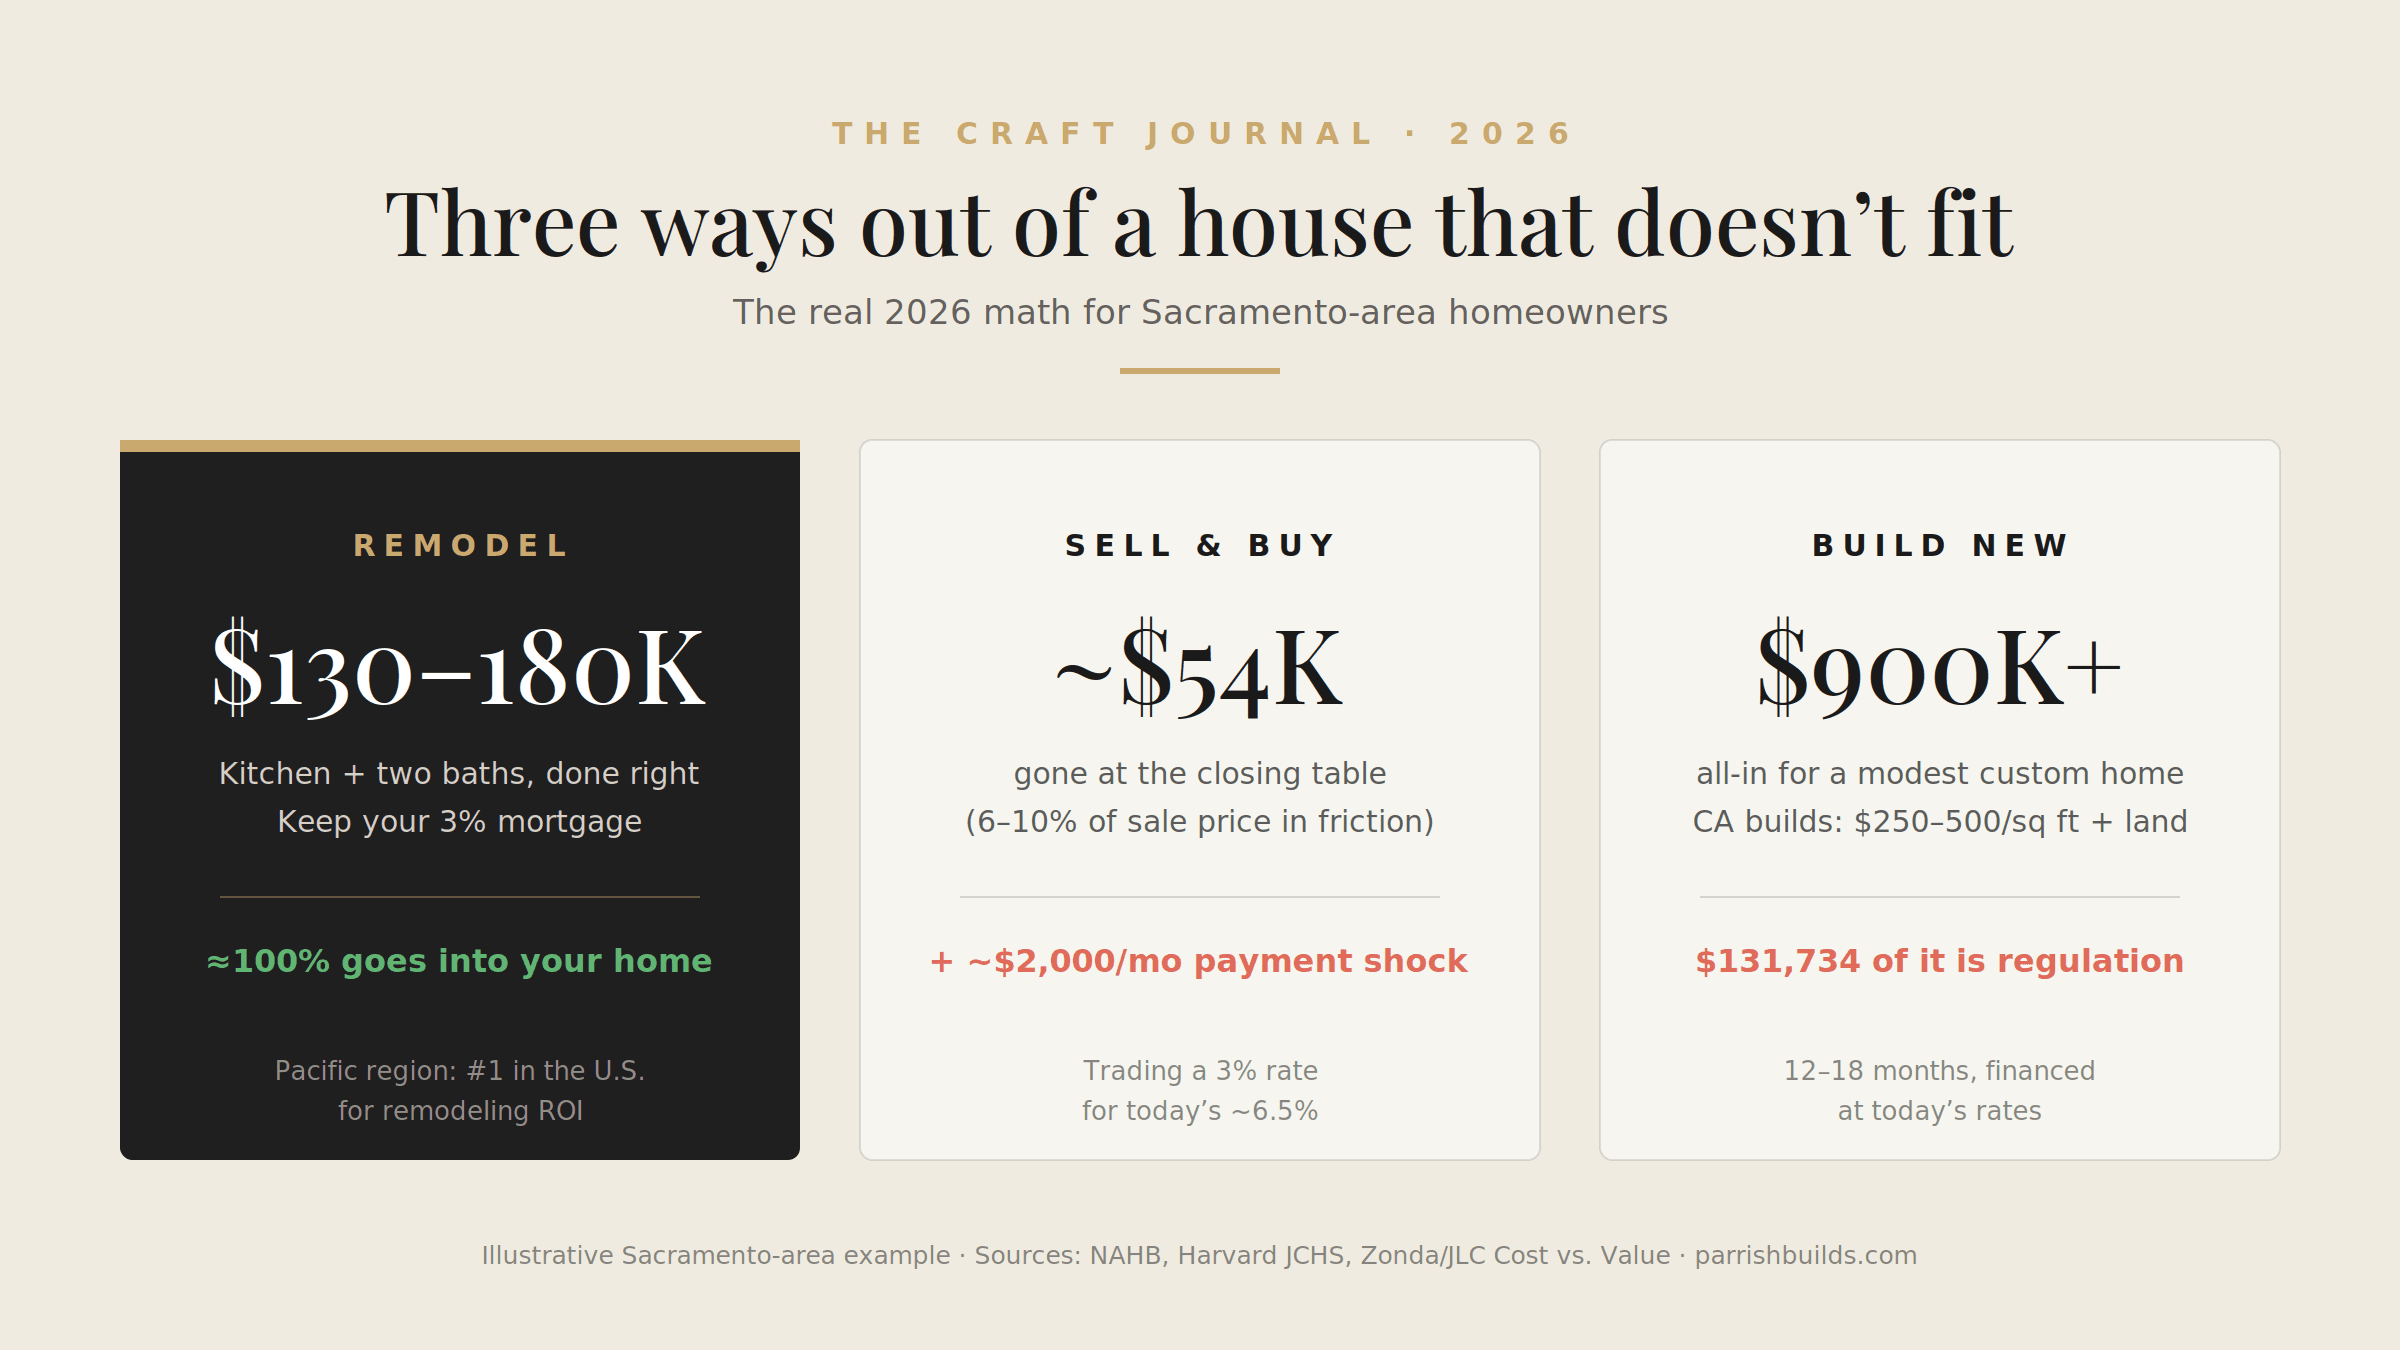
Three paths, side by side
Illustrative Sacramento-area example: a $600K Carmichael home with a 3% mortgage from 2021. Full math in the worked example below.
Sources: NAHB, Harvard JCHS, Zonda/JLC Cost vs. Value. Assumptions detailed in-post.
The elephant in the room: your mortgage rate
Before comparing construction costs, start with the single biggest financial fact in American housing right now: the mortgage you already have.
Roughly half of all homeowners with a mortgage are sitting on a rate of 4% or below, and about 80% are below 6% — rates that simply don’t exist for new loans today.1 Economists call this the “lock-in effect,” and Harvard’s Joint Center for Housing Studies has documented how powerfully it shapes behavior: residential mobility hit a record low of 11.2% in 2024, driven mostly by homeowners who won’t give up below-market rates.2
The lock-in effect
Half of America is locked in
Share of mortgaged U.S. homeowners by interest rate, Q3 2025
51.5% of mortgaged homeowners hold a rate at or below 4% — every one of them faces a payment jump to move.
Realtor.com mortgage-rate distribution analysis, Q3 2025; Harvard Joint Center for Housing Studies.
Here’s what that means in dollars. A homeowner who bought or refinanced around 3% in 2020–2021 and moves to a similar home at today’s rates in the mid-6% range absorbs a payment shock of roughly $680–$1,000 per month on principal and interest alone — over $8,000 per year, forever, on the same amount of house. That’s not a moving cost. That’s a permanent tax on moving.
The rate math
The payment shock, itemized
Same family, principal & interest only — 30-year fixed
Staying at 3.1% versus moving up at ~6.5% on the same family's numbers.
Illustrative: $380K balance at 3.1% vs. $600K new loan at ~6.5%. Full assumptions in the worked example.
One 2026 national survey found that 73% of homeowners with mortgages would consider moving if they could take their rate with them — and one in four homeowners with sub-5% rates say no amount of money would convince them to give it up.3 You can’t take your rate with you. But you can keep it and change the house around you. That’s why Harvard JCHS projects homeowner improvement spending heading toward a record of roughly $524 billion — the “stay put and improve” economy is a rational response to the math, not a fad.4
What building new actually costs in 2026
The National Association of Home Builders’ most recent Construction Cost Survey puts average construction costs at $428,215 for a typical 2,647 sq ft new home — about $162/sq ft in hard construction costs, before land and before the builder’s fee. Add a general contractor’s standard 15–25% overhead and profit, and the effective national number is closer to $195/sq ft. NAHB’s average sales price for a new home with land: $665,298.5
And those are national averages. For live 2026 planning, industry analysts peg realistic production/semi-custom construction at $175–$320/sq ft and custom homes at $300–$600+/sq ft — with California sitting at the top of the state range, roughly $250–$500/sq ft before land. [REF NEEDED — link the 2026 build-cost roundup we approve before publish]
Then stack on the costs people forget:
Land. The national median lot price is around $60,000 — but in the Pacific region, median lot values run around $152,000, and NAHB puts the average cost of a finished lot with financing at $91,057.5 Infill lots in established Sacramento-area neighborhoods (the places people actually want to live) routinely exceed that.
Regulation. A June 2026 NAHB study found that federal, state, and local regulation now adds $131,734 to the average new single-family home — 26.4% of the average new-home sales price of $499,500. That figure is up more than 40% in five years, growing at over twice the pace of household income.6 California’s regulatory environment (Title 24 energy code, fire hardening, impact fees) is among the reasons the state sits at the top of the per-square-foot rankings.
Tariffs and materials. NAHB estimated a typical cost effect of about $10,900 per home from recent tariff actions, and tariffs on imported cabinets and vanities were set at 25% in late 2025 with further increases scheduled.7
Financing and time. Construction loans typically run 1–2 percentage points above standard mortgage rates, adding $10,000–$30,000 in carrying costs over a 12-month build. Production homes take 7–9 months; custom builds average 12–18 months from permit to move-in. And at the end of it, your new mortgage is at today’s rates — you’ve lost the locked-in rate and paid custom-construction pricing.
Real talk for our region: a modest 2,200 sq ft custom home in the greater Sacramento area, on an infill lot, at even the low end of California’s range, pencils out well north of $800K all-in once land, fees, and financing are counted — against a Sacramento median resale price of roughly $500K.8
What selling and buying actually costs
“Just move” sounds like the simple option because the costs are hidden inside the transaction. They’re not small.
Industry data consistently puts total seller-side costs at 6–10% of the sale price — agent commissions still average around 5.4–5.7% total despite the 2024 NAR settlement, plus 1–3% in closing costs, plus repairs, staging, concessions, and moving. Several full-cost analyses that include pre-sale prep and the move itself land at 9–10% or more.9
On a $600,000 Carmichael home, that’s $45,000–$60,000 that evaporates at the closing table — money that buys you nothing. It doesn’t improve your kitchen. It doesn’t add a bathroom. It pays for the privilege of transacting.
Then you buy the next house: 2–5% of the loan amount in buyer-side closing costs, the new mortgage at current rates, and — here’s the part people underestimate — the new house usually needs work too. Very few resale homes are move-in perfect for your family. Many of our clients came to us within two years of buying, remodeling the house they just paid a premium to acquire.
Add the lock-in math from above and the true cost of a lateral move for a 2020–2021 borrower is often $50K+ in transaction friction plus $8,000+/year in permanent payment increase — before a single improvement to your actual living situation.
What remodeling costs — and returns
Remodeling isn’t cheap either, and we’d never pretend otherwise. National data puts the average whole-home renovation for a 1,250–1,600 sq ft home around $52,000, with kitchen and bath projects ranging from under $30K for a strategic refresh to well into six figures for gut renovations and additions.10

The difference is what the money does. Every dollar goes into your house instead of into commissions, transfer taxes, and interest-rate spread. And unlike a new build or a purchase, you keep your existing mortgage.
The Zonda/JLC Cost vs. Value Report — the industry’s standard ROI study across 100+ U.S. markets — shows how much of remodel spending comes back at resale:
Return on spend
What comes back at resale
Percent of remodel cost recouped at resale
A right-sized remodel recoups 2–3× more of its cost at resale than a luxury gut renovation.
Zonda/JLC Cost vs. Value Report, 2025/2026, national data.
Two takeaways worth internalizing:
Right-sized beats maximal. The data is unambiguous, year after year: scope-appropriate midrange remodels recoup dramatically more than luxury gut jobs. This matches how we build estimates — matching finish level to the home and the neighborhood, not the Pinterest board. There’s a “neighborhood ceiling”: buyers pay comp prices, so your home’s post-remodel value shouldn’t stray far above the median comparable sale in your area.
The Pacific region now leads the country. The most recent Cost vs. Value Report ranked the Pacific region (CA/OR/WA) #1 in the nation for remodeling ROI — the first time in the report’s 23-year history it displaced New England.11 Remodel dollars go further here, in resale terms, than anywhere else in the country.
And ROI numbers only measure resale value. They assign zero value to the ten years you actually live in the house. A midrange bathroom remodel that “only” returns 75% at resale also returns a decade of not fighting over one shower every morning. No spreadsheet line captures that, but it’s the reason most of our clients remodel.
The side-by-side: a Carmichael worked example
Take a real scenario we see constantly: a family in a 1,900 sq ft Carmichael ranch worth ~$600K, bought in 2020, refinanced at 3.1%, ~$380K remaining on the mortgage. The kitchen is original, the hall bath is failing, and the primary bath is a 1978 time capsule. Three paths:
Path 1 — Sell and buy the “done” house. The updated 2,200 sq ft home nearby lists at $775K. Selling costs at ~9% consume ~$54K of their equity. New loan of roughly $600K at ~6.5% versus the old $380K at 3.1% pushes the monthly P&I up by roughly $2,000. Ten-year cost of the move: transaction costs plus well over $200K in additional interest — for a house someone else designed.
Path 2 — Build new. A 2,200 sq ft custom home at a conservative $300/sq ft is $660K in construction alone. Add a Sacramento-area lot, fees and permits, construction-loan carrying costs, plus selling the current home (another ~$54K in transaction costs), and they’re past $900K all-in, financed at today’s rates, 12–18 months from now.
Path 3 — Remodel. Full kitchen remodel plus both bathrooms, done right, at PCI-typical scope: roughly $130K–$180K depending on selections and what we find in the walls. The 3.1% mortgage stays. Cost vs. Value data suggests a meaningful share returns at resale — and per the neighborhood data above, this scope fits comfortably under the area’s comp ceiling. The family stays in their school district, keeps the yard the kids grew up in, and gets a house designed around how they live.
Path 3 costs a fraction of the alternatives, preserves the irreplaceable mortgage, and is the only option where 100% of the spend goes into the house.
Follow the money
Where your money actually goes
Ten-year view of the same Carmichael family's three options (illustrative)
Only the remodel puts every dollar into the house they own.
Illustrative Carmichael example above; friction figures from NAHB and Bankrate.
When moving or building actually wins
We promised honesty, so here it is. Remodeling is not the answer when:
- The location is the problem. No remodel fixes a commute, a school district, or a lot you’ve outgrown. If you need to be somewhere else, move.
- The gap is structural. If you need 1,500 more square feet on a lot that can’t support an addition, buying larger may beat forcing it. (This is a real conversation we have — we’ve talked clients out of additions where the budget-to-value math didn’t work.)
- You’re over the neighborhood ceiling. If your home is already the most expensive on the street, a six-figure remodel puts money in a place the market won’t return it. Spend for your enjoyment if you’re staying 10+ years — but know that going in.
- You own cheap land in a thin market. National analyses note that building beats buying mainly where lots are inexpensive and existing inventory is scarce. That describes parts of rural America. It does not describe Carmichael, Roseville, or Folsom.
- Your current rate isn’t special. If you bought in 2023–2025 at 6–7%, the lock-in penalty largely disappears from the equation, and the move-vs-remodel decision comes down to transaction costs and fit alone.
The bottom line
In 2026, the average new home carries $131K in regulatory cost baked into its price, California construction runs $250–$500 per square foot before land, selling a home consumes 6–10% of its value in pure friction, and half of American homeowners hold a mortgage rate they will never see again. Against that backdrop, a well-scoped remodel — especially in the Pacific region, now the #1 remodeling-ROI region in the country — is usually the most capital-efficient way to get the home you actually want.
Not always. But usually. And the only way to know which side of “usually” you’re on is to run your real numbers.
Thinking through remodel vs. move for your own house? Bring us your scenario — we’ll give you a straight answer, even if the answer is “move.” Request an estimate or book a discovery call.
Frequently Asked Questions
For most homeowners with a pre-2022 mortgage rate, remodeling is significantly cheaper. Selling costs consume 6–10% of your home’s value, and replacing a 3% mortgage with a 6.5% one adds roughly $8,000+ per year on a comparable loan. A remodel puts 100% of your spend into the house and preserves your existing rate.
Realistic California construction costs run roughly $250–$500 per square foot before land, permits, and financing. With Sacramento-area lot costs, regulatory fees (NAHB pegs regulation at over $131,000 per average new home nationally), and construction-loan carrying costs, a modest custom home typically pencils well above comparable resale prices.
Zonda/JLC Cost vs. Value Report, midrange kitchen remodels recoup roughly 96–113% of their cost and midrange bathroom remodels roughly 74–80% — far more than upscale gut renovations (36–44%). The Pacific region currently leads the nation in remodeling ROI.
homeowners with mortgages have rates at or below 4%. Selling means giving up that rate for one in the mid-6% range — a payment increase of roughly $680–$1,000/month on a comparable home. This “lock-in” is why residential mobility hit a record low and why remodeling spending is near record highs.
Free Download — 2026 Sacramento Kitchen & Bath Cost Guide
Real pricing data for homeowners planning a remodel in Sacramento. Cost ranges by project tier, a budget breakdown, and the questions you should ask before signing with any contractor. Enter your details below and we'll email it to you.
No spam. Unsubscribe anytime.
Further Reading and Information
- The State of the Nation’s Housing 2026 — Harvard JCHS’s annual report; documents the lock-in effect and the record-low 11.2% mobility rate behind the “stay put and improve” economy.
- Cost vs. Value Report — Zonda/JLC’s annual study of remodel cost recouped at resale across 100+ U.S. markets; source for the ROI figures in this post.
- Regulatory Costs Jump 40% in Five Years — NAHB’s June 2026 study putting regulation at $131,734 of the average new-home price.
References
- New American Funding. “Analysis of Realtor.com Mortgage-Rate Distribution Data, Q3 2025.” Newamericanfunding.com, Jan. 2026. ↩
- Joint Center for Housing Studies of Harvard University. “The State of the Nation’s Housing 2026.” Jchs.harvard.edu, 2026, www.jchs.harvard.edu. ↩
- Storable. “2026 Moving Forecast.” Storable.com, Feb. 2026. ↩
- Joint Center for Housing Studies of Harvard University. “Leading Indicator of Remodeling Activity, Q1 2026.” Jchs.harvard.edu, 2026, www.jchs.harvard.edu. ↩
- National Association of Home Builders. “Cost of Constructing a Home.” Nahb.org, 2025, www.nahb.org. ↩
- National Association of Home Builders. “Regulatory Costs Jump 40% in Five Years, Add $131,734 to New Home Prices.” Nahb.org, June 2026, www.nahb.org. ↩
- National Association of Home Builders. “Housing Market Index Special Questions on Tariffs.” Nahb.org, Apr. 2025, www.nahb.org. ↩
- Redfin. “Sacramento Housing Market Trends.” Redfin.com, June 2026, www.redfin.com. ↩
- Bankrate. “How Much Does It Cost to Sell a House?” Bankrate.com, 2026, www.bankrate.com. ↩
- Angi. “How Much Does It Cost to Renovate a House?” Angi.com, 2026, www.angi.com. ↩
- Zonda / JLC. “2025–2026 Cost vs. Value Report.” Jlconline.com, 2026, www.jlconline.com. ↩